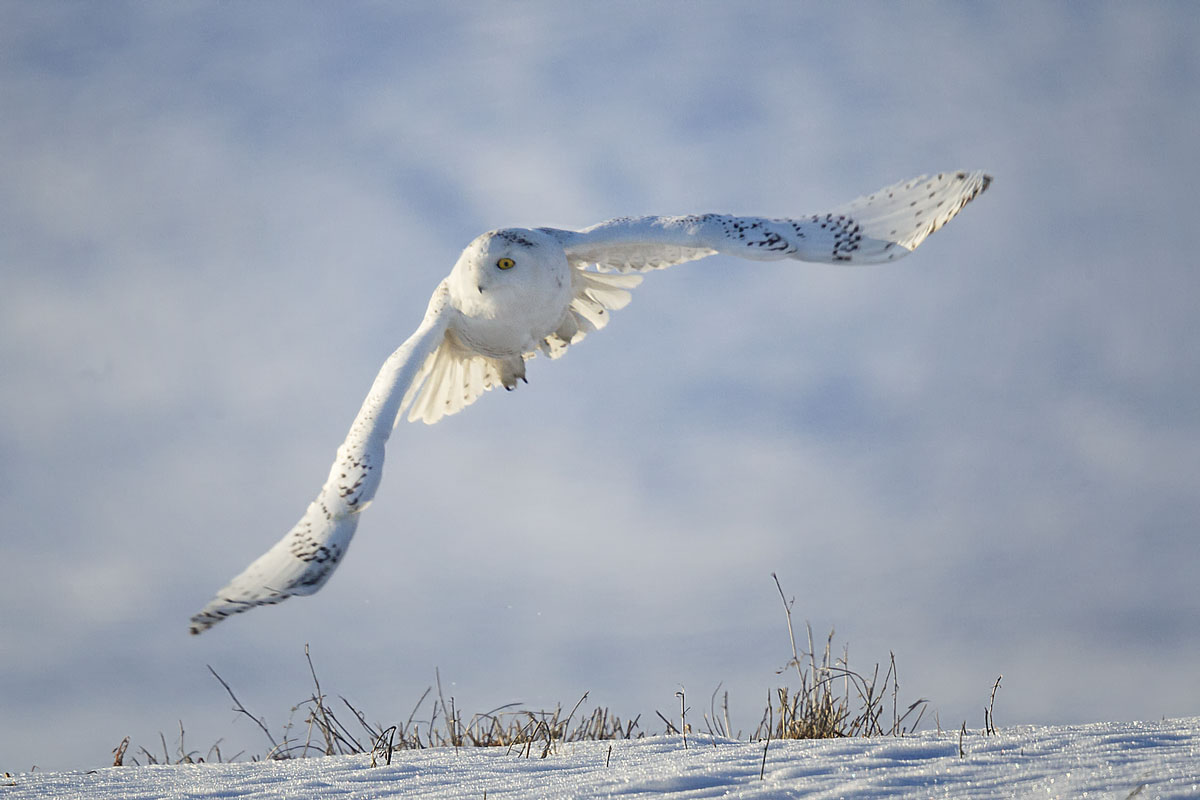
How does this year’s irruption compare with last winter’s? Cornell’s eBird team knows. (©Alan Richard)
One of the most common questions we’ve been getting lately is, How does this winter’s irruption compare with last year’s, or with previous winters?
Fortunately, our colleague Andrew Farnsworth at the Cornell Lab of Ornithology tackled just this question over at BirdCast, the CLO project that forecasts bird migration using radar and other information. Andrew and Benjamin Van Doren have used eBird data to plot the intensity of recent irruptions in the Northeast, with fascinating results — check out their post here.
eBird has been an incredible resource for following not just snowy owl movements, but bird distribution, migration and range changes in general. We’re pleased to be part of that wider effort through Project SNOWstorm.


3 Comments on “BirdCast: Comparing Irruptions”
226+ Snowies in Wisconsin so far this year compared to 173 by this date last year. Lower percentage of hatch-year birds this year, while statewide distribution fairly similar across both.
Gearing up to be another good year
That’s insane Ryan. It’s definitely more of an Upper Midwest irruption than last year.